Measuring the performance characteristics of a medical device
Introduction
Before joining the pharma sector, I spent 6 beautiful years working in medical device/Point of Care Testing industry. While working, I coursed a couple of master degrees as well, where I decided to work on my idea of building my first relatively complex (with significant positive impact) shiny app as part of one of my master’s final project. The aim of this shiny app was to easily measure the performance characteristics of the medical device (i.e when verifying the performance of a certain batch) by collecting many of the statistical methods recommended by the CLSI guidelines.
In this post I am going to focus on introducing the performance characteristics by providing a general overview and I will be sharing the link of the video where I demo this shiny app.
Point of care testing
Medical conditions, physical location of the patient, and treatment regimens often require test results to be obtained quickly, so appropiate medical care can be administered expeditiously. Laboratory medicine professionals are challenged by the increasing demands for providing faster turnaround of test results, without comprising accuracy. Here is when the Point of Care Testing (POCT) plays a great role. POCT, also known as “near patient testing”, is the testing that is performed near or at the site of the patient care, with the result leading to a possible change in the care of the patient. It is all testing performed outside a central laboratory environment, generally nearer to, or at the site of, the patient. Advances in technology and the development of microtechniques and portable test instruments (POCT devices) have made it possible to move medical testing closer to the patient. In general, POCT can offer the following benefits over the central laboratory testing:
- Access to test results in shorter time frames leads to earlier implementation of treatment decisions, which may result in better patient care.
- Specimen transport time is eliminated or minimized, leading to faster testing after acquisition and fewer concerns related to sample stability, which can be critical for some tets.
- POCT reduces the risk of preexamination errors that may accompany traditional central laboratory testing, such as handling, transport, and labeling of samples.
- Sampling-related blood loss is decreased, an important feature in settings like operating room or intensive care unit (ICU), where blood conservation is key, or in pediatric testing. Most POCT devices use smaller samples.
Understanding some general concepts
My professional POCT related experience is mainly focused on Portable Coagulometers. Before going over the main topic of the performance characteristics, let’s briefly present some of the important topics that will help us understand the later sections.
Anticoagulants
Blood coagulation is a crucial process to human being, and death will be caused if lack of the hemostatic system in the body. On the other hand, excessive coagulation will lead to the diseases, such as strokes, heart attacks and pulmonary embolism (Palta et al). Therefore, anticoagulants play a vital role in preventing excessive coagulation. Anticoagulant is a chemical compound or proteins that will inhibit the blood clotting by bind- ing to the clotting factor(s) and prevent it from binding to phospholipids membrane. Hence, prevention and pretreatment of cardiovascular disorder can be done by anticoagulant therapy. There are different types of anticoagulants. Each anticoagulant varies in its effect on routine and speciality coagulation assays and each drug may require distinct laboratory assays to measure drug concentration or activity (Funk et al). Anti Vitamin K (AVK) is one type of anticoagulant that inhibits the function of vitamin K, leading to prevention of thrombosis.
Prothrombin time (PT) and International Normalized Ratio (INR)
As previously said, anticoagulants play a vital role in preventing excessive blood coagulation/anticoagulation. Focusing on AVK drugs, the dose of these drugs must be adjusted periodically to ensure that an adequate, but not excessive, degree of anticoagulation is achieved. Prothrombin time (PT) test is the most widely performed coagulation assay. It is a measure of the amount of time in seconds that it takes for your blood to produce a thrombus or a blood clot. PT test evaluates whether or not your blood clots at a normal rate. PT is the clotting time of a plasma (or whole blood) sample in the presence of a preparation of thromboplastin and the appropriate amount of calcium ions. The wide use of the PT test has resulted in the introduction of numerous thromboplastin reagents and coagulation instruments. Thromboplastin is a reagent containing tissue factor (the specific protein responsible for initiating the coagulation) and coagulant phospholipids (necessary for surface assembly of the coagulation complexes), both of which are needed in the activation of the coagulation. Thromboplastin reagents can vary widely in their response to AVK therapy leading to different PT results, depending on the source material from which they are derived. They are prepared commercially and, with the aim of being able to interpret the results of the PT test, it is essential that each reagent is correctly calibrated. In order to offset variation in thromboplastin reagent responsiveness (PT variation between different reagent/instrument combinations) and provide a common scale for expressing PT results, the World Health Organization (WHO) introduced the International Normalized Ratio (INR). The INR is a mathematical conversion of the PT calculated as follows. See the WHO guidelines for thromboplastins and plasma used to control oral anticoagulant therapy.
\[ INR = (PT/MNPT)^{ISI} \tag{1}\]
Where:
- PT is the measure of time in seconds that it takes for the blood to produce a thrombus or a blood clott.
- MNPT is the geometric mean of the PTs of the healthy adult population and can be approximated by the geometric mean of the PT calculated from at least 20 fresh samples from healthy individuals
- ISI Mathematical index obtained in the calibration process of one instrument/reagent combination.
Take a look at the CLSI H54-A guideline if you want to go deeper on this ISI and MNPT concepts. The portable coagulometer’s INR measuring range is around 0.6-8.0 (the greater the INR the more anticoagulated the blood). Healthy non-anticoagulated subjects should have an INR between 0.8-1.2. Target INR ranges for anticoagulated patients:
- 2.0-3.0 INR for subjects with Atrial Fibrilation (AF), Deep Vein Thrombosis or Pulmonary Embolism (PE)
- 2.5-3.5 INR for subjects with Mechanical Mitral Valve, Ventricular Assist Device (VAD).
Main anticoagulated INR ranges are INR < 2, 2≤INR<3.5, 3.5≤INR< 4.5 and INR ≥ 4.5. If the INR is lower than 2 the subject is underdosed and the doctor will increase the AVK dose, to prevent thromboembolic events. On the other hand, if INR > 3.5, the doctor will reduce the AVK dose as the blood is too anticoagulated (increased risk of major bleedings).
Performance characteristics of medical devices: Imprecision, Trueness (Bias) and Accuracy
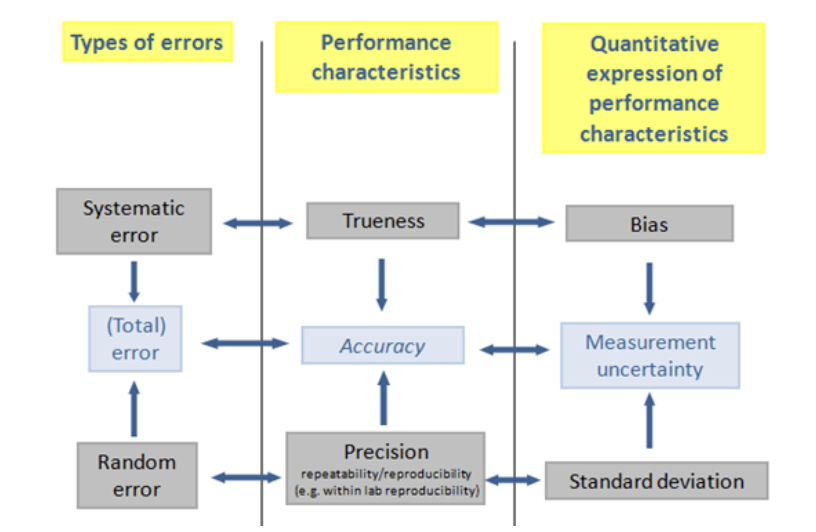
POCT devices (POC-INR) can safely and easily monitor VKA efficacy but need to be evaluated in practice, since there are several type of errors that can lead to erroneus results. Main measurement errors, which are the differences between the measured value and the true value, fall into two main categories, which are systematic error and random error. Systematic errors are predictable problems influencing observations consistently in one direction, while random errors are more unpredictable.
It can be said that there are three performance characteristics:
- Precision, which is related to random error, it is usually expressed as standard deviation or coefficient of variation. Precision can be stated as the closeness of agreement between indications or measured quantity values obtained by replicate measurements on the same or similar objects under specified conditions.
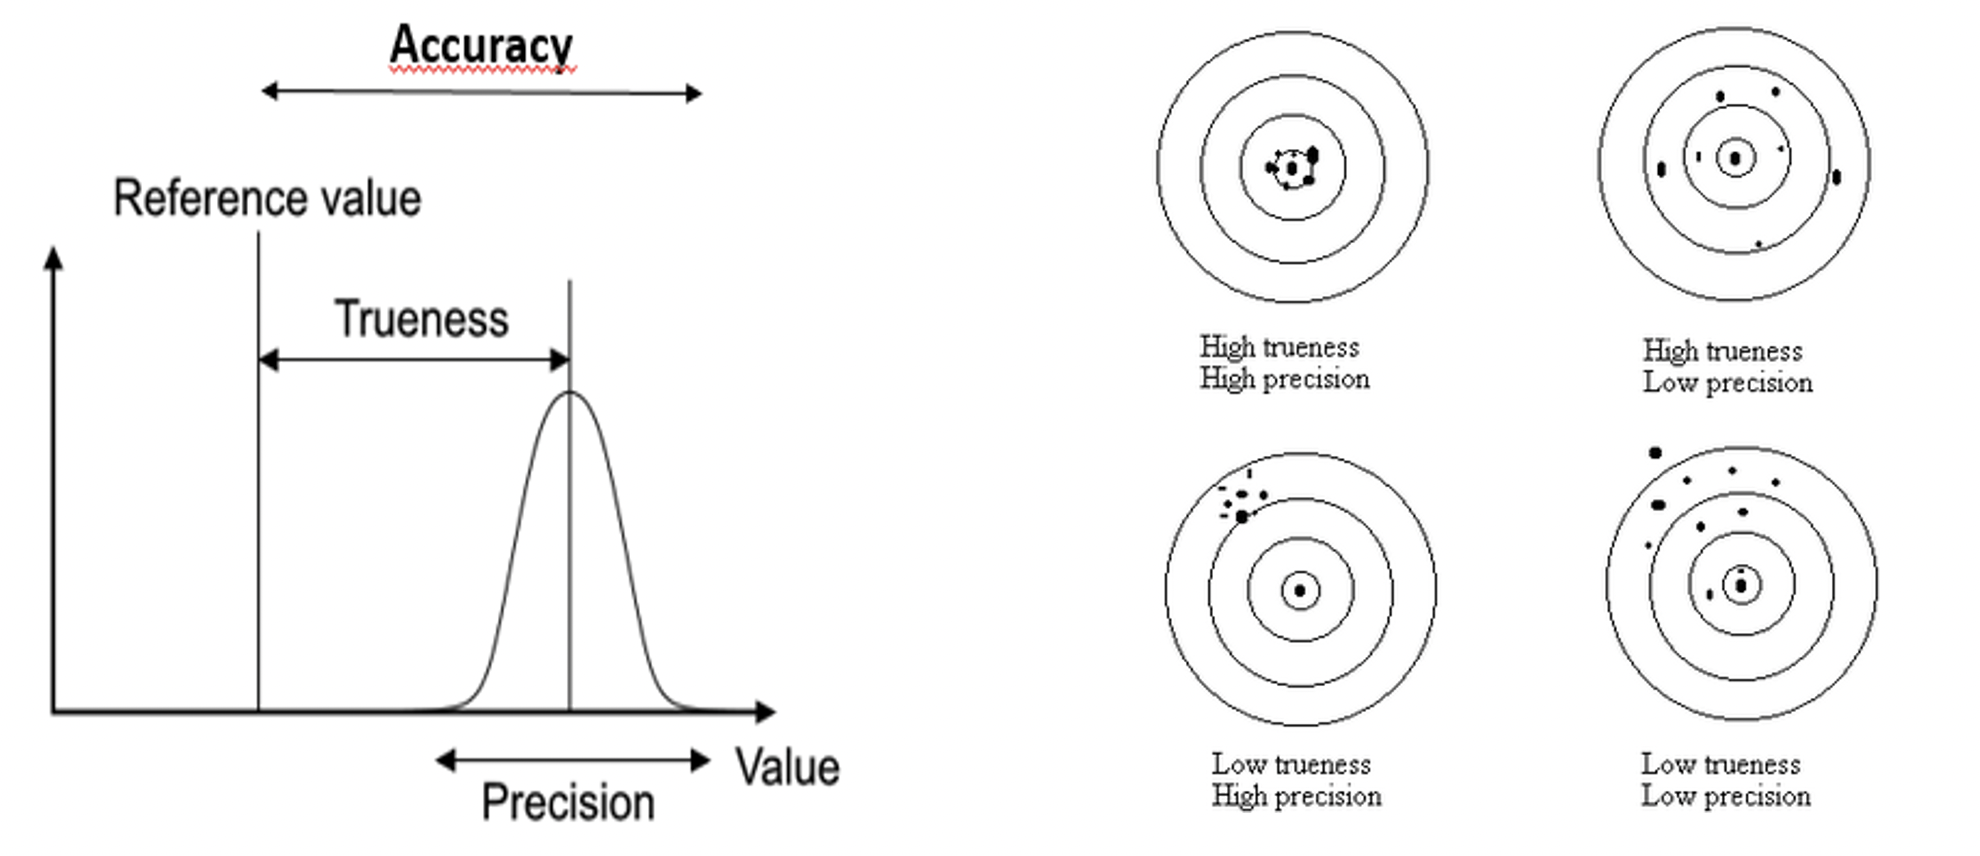
- Trueness, which is related to systematic measurement error, it is usually expressed in terms of bias. Trueness can be defined as the closeness of agreement between the average of an infinite number of replicate measured quantity values and a reference quantity value. It is straightforward to see that since the values are averaged, the performance characteristic imprecision is negligible and it is not affecting in the estimate of trueness.
- Accuracy is related to the total error, which is composed by both the systematic error and the random error. In other words, the performance characteristics trueness and precision are combined into the concept of accuracy. It is the closseness of agreement between a measured value and a true quantity value of a measurand. If the measurement has good precision (low coefficient of variation value) and trueness (low bias), it can be said that the measurement result is accurate. Accuracy is usually expressed as total analytical error interval or concordance agreement analysis.

In Figure 3 a graphical representation of the three performance characteristics mentioned above can be seen. The term ”Reference Value” refers to the term ”true value” mentioned above. A certain external laboratory method must be included in order to have this reference or true value.

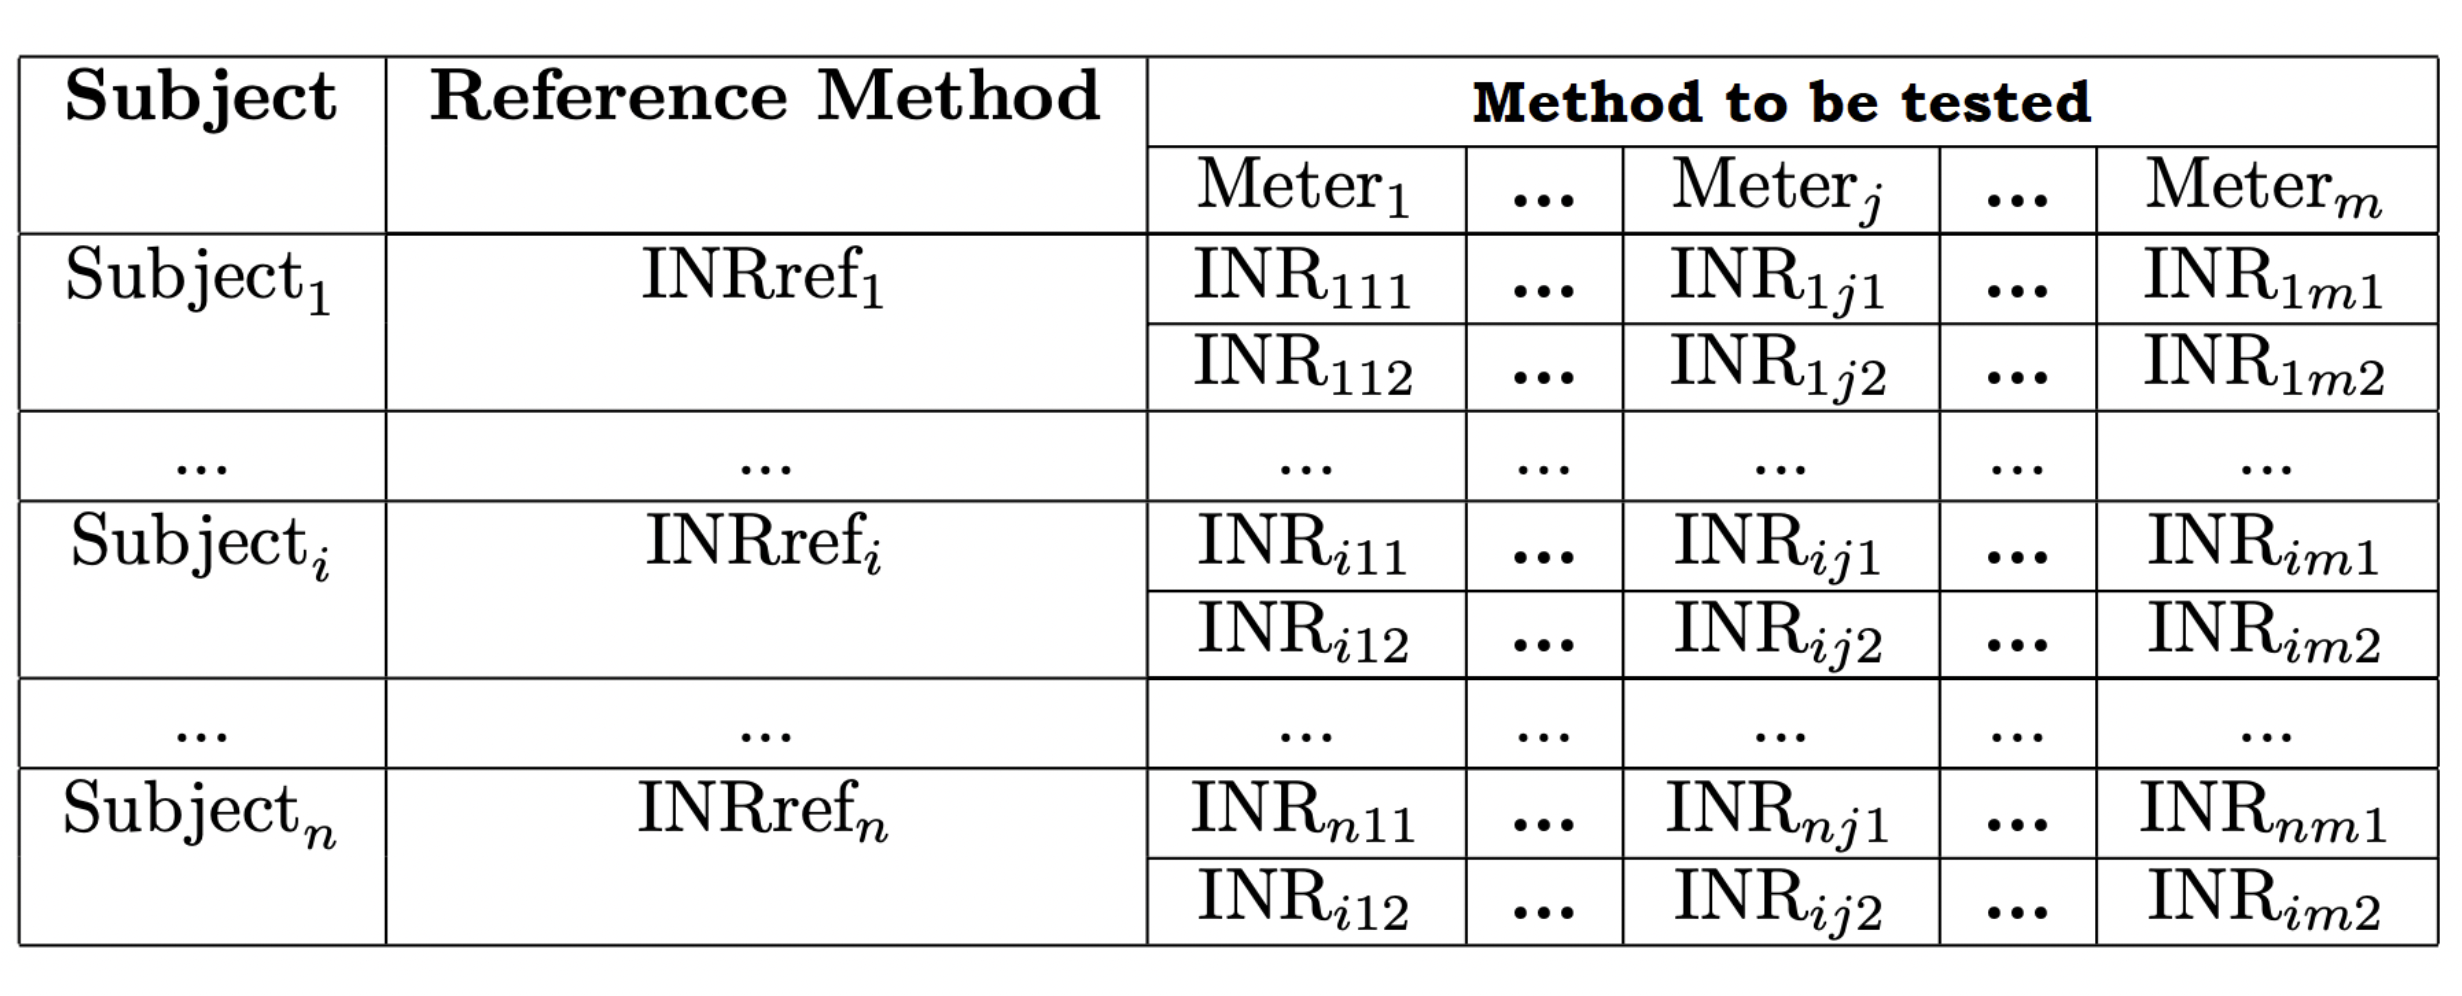
In order to evaluate these performance characteristics of the manufactured batch of the system under analysis, the following scheme can be followed in the clinical study.

\(INR_{ijk}\) is the INR value obtained for the subject \(i (i = 1, 2...n)\), using the Meter \(j\) in the \(k\)th run (\(k\) being 1 or 2). The fact that \(k\) can only take 1 and 2 values means two runs are carried out for each subject. In each run one INR replicate will be obtained with each Meter. Hence, 2 x m results will be collected for each subject and 2 x m x n results will be achieved in the entire clinical study by using the system under analysis.
Likewise, it is straightforward to see in Table 1 that just one INR is obtained (\(INRref_i\)) by using the reference method for each subject. This reference method refers to one external laboratory system that provides INR values considered as true or reference values (necessary for trueness and accuracy evaluation). The closer the \(INR_{ijk}\) values to the corresponding reference \(INRref_i\), the better will be the accuracy.
Shiny application
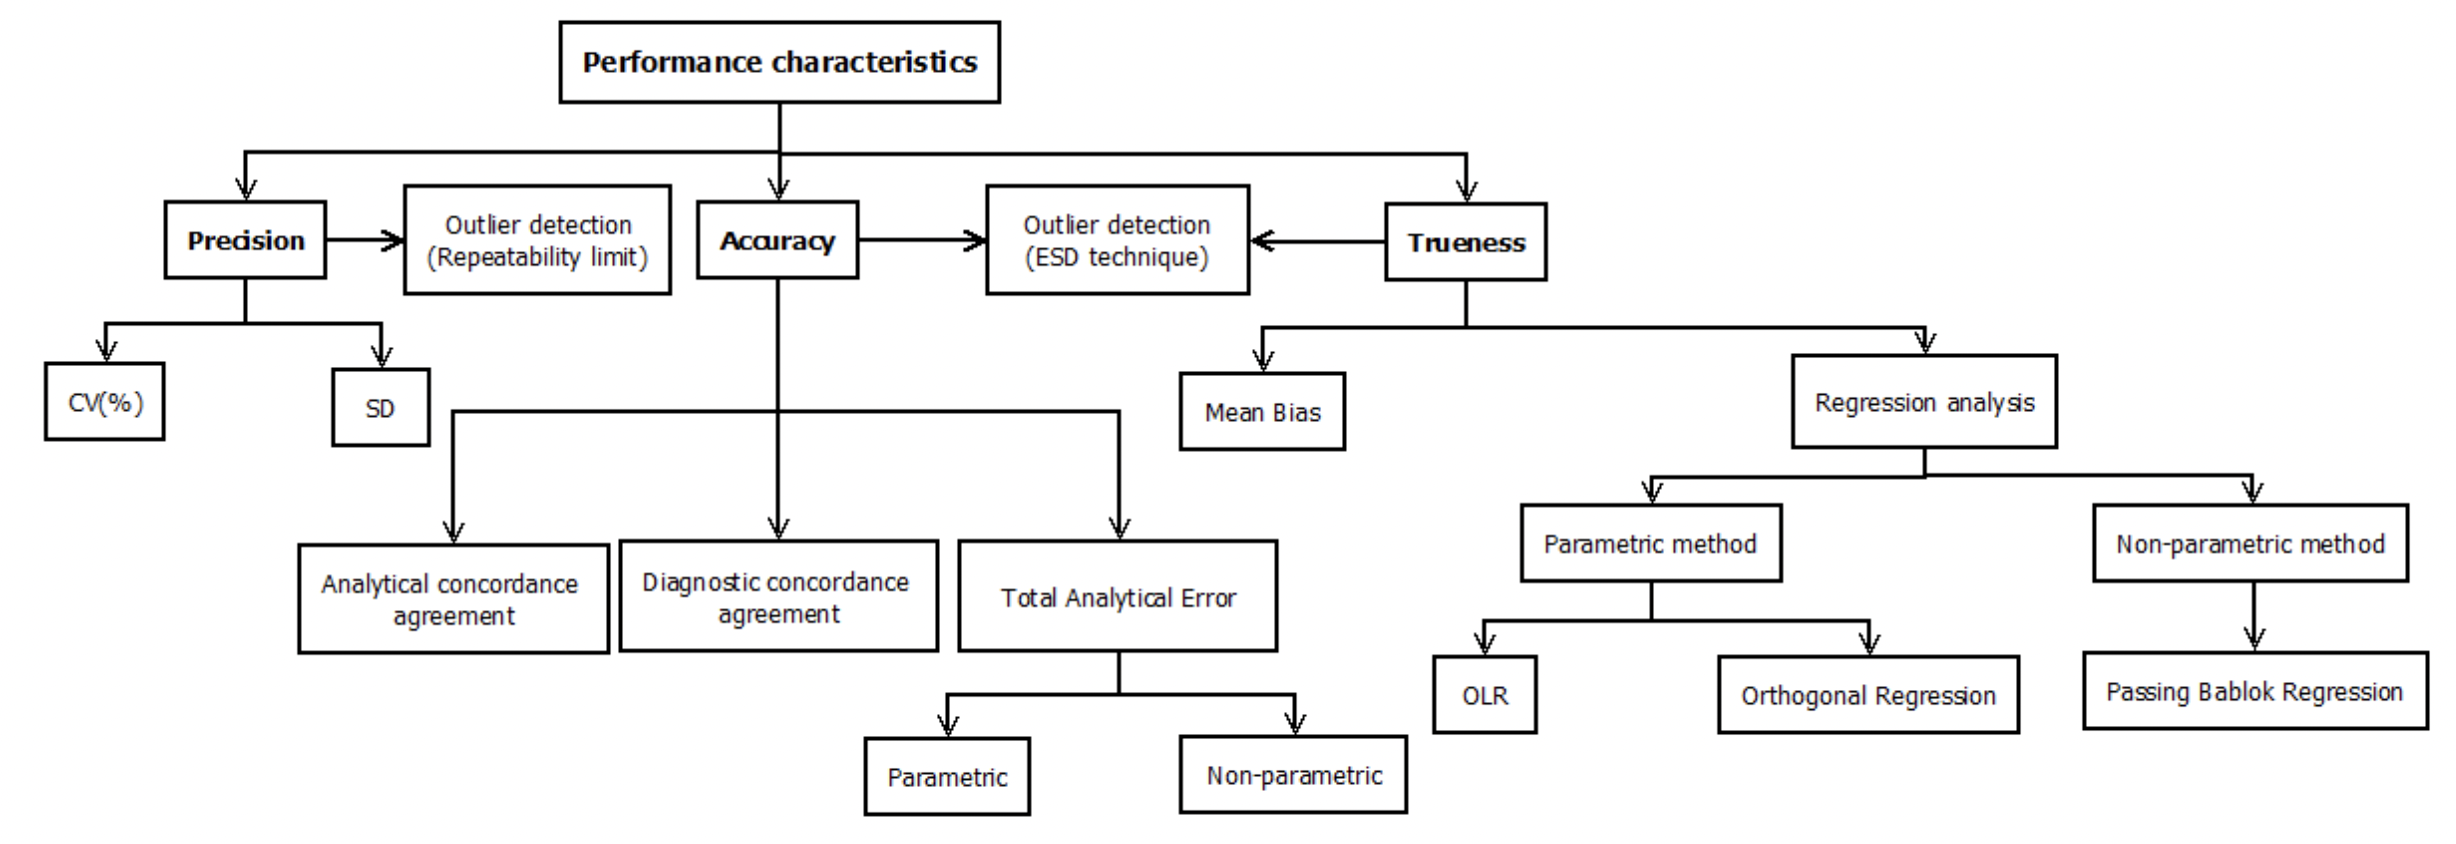
As one of my master’s thesis project, I decided to create a Shiny application containing a wide spectrum of statistical and visualization tools used for the numerical quantification as well as graphical representation of the performance characteristics presented above.
See the diagram containing all the methods we are going to touchbase in some future posts.

The application is showcased in this video: